Daily Leverage Certificates
DLC Hotline: (65) 6226 2828
Market Commentary (Hong Kong)
For the week ending 19 April 2024
USDJPY is now at a fresh 34-year high; the highest traded this week was 154.79. Concurrently, the Nikkei 225 fell to a 10-week low. Both the Dollar Index and the yield on the US 10-year Treasury Bond traded at new year-to-date highs.
● Tesla plans to reduce its global workforce by 10% or approximately 14,000 employees.
● Samsung regained its position as global leader in smartphone sales with its Q1 data. Apple followed in second place.
● China’s Q1 GDP was up 5.3% y-o-y. Retail sales and industrial growth numbers were also encouraging.
● The Biden Admin announced a threefold increase in tariffs at selected Chinese steel and aluminum products.
● According to SWIFT, the Chinese yuan’s portion of international transactions rose to 4.7% in March. The euro’s share fell to 21.93%, a drop of 1.32% over the previous month.
● According to the CAAM, sales of Chinese passenger cars in Q1 this year jumped 26.4% to 3.4 million units.
Hang Seng Index closed this week at 16224, down 498 points or 2.98%. This week’s bearish close is the weakest end-of-week performance since the last nine weeks. It is possible that the Hang Seng Index has fallen out of its consolidation pattern. Based on price action, the index was rejected by 17000 and in the next week or two we will see how it performs at 16000. As written last week, moving averages are flattening which is a potential sign that the HSI could be moving from a downtrend mode to a sideway range. This week’s close brings the index back below its entire basket of moving average indicators. This setup is associated with further declines.
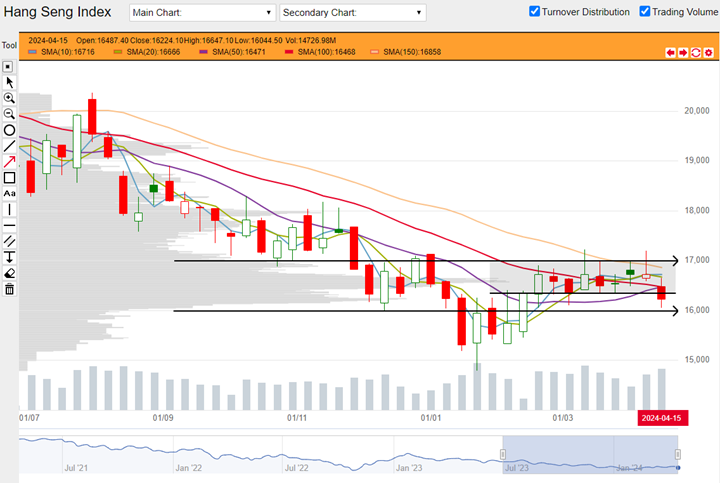
HSI weekly chart from 03 July 2023 to 19 March 2024 (Source: DLC.socgen.com)
Hang Seng Tech closed the week at 3278, down 196 points or 5.65%. It is likely that HSTech has reverted back to a downtrending mode since this week’s drop established the recent top as a lower swing high. The index is also trading below its basket of moving averages. This is a setup associated with further losses. 3250 could be a potential support as this week’s low could be a nod to its presence.
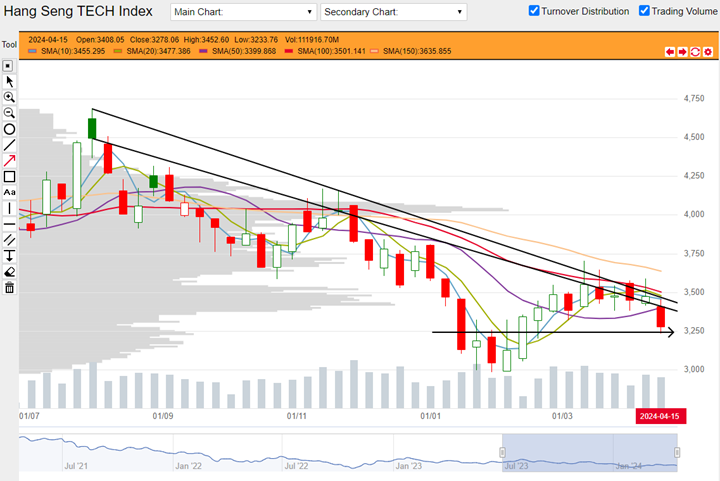
HSTech weekly chart from 03 July 2023 to 19 April 2024 (Source: DLC.socgen.com)
The Dow fell for the third week in a row but compared to the previous week’s close, was up 0.1%. The action this week came from the Nasdaq which dived 5.36% by end-of-week. Notable losses were TSLA (down 14.67%), NVDA (down 15.05%), ASML (down 11.37%) and MU (down 14.75%).
The next FOMC meeting is scheduled on 01 May 2024.
Fed funds futures on rate hike probability by next Fed meeting as at this week’s close:
● 96.8% probability of no change |3.2% probability of 25 basis points cut
Fed funds futures on rate hike probability by next Fed meeting at last week’s close:
● 94.1% probability of no change |5.9% probability of 25 basis points cut
Probabilities on the CME Fedwatch Tool indicate no more rate hikes for this year but also indicate possibility for rates to stay at current level until April next year. Probabilities predict up to 125 basis points cut for the whole of 2024 and up to 175 basis points between now till April 2025.
Shanghai made a new year-to-date high this week and combined with its end-of-week close above its basket of moving averages, this could be a setup associated with further gains. Shenzhen is up for the week but closed at a 8-week low. It is still trapped between its moving averages.
Other news:
● AIA, Kuaishou, Meituan, Sunny Optical, Tencent, Wuxi Biologics and Xiaomi bought back shares.
● PetroChina printed a new 52-week high. Baidu, Galaxy Entertainment, HKEX, Sands China, Sunny Optical, Wuxi Bio and XPeng printed new 52-week lows.
● According to Xiaomi CEO Lei Jun, the sales of the company’s first electric car may have exceeded expectations.
Technical observations
China Construction Bank 939.hk continues uptrend, poised at 26-month trendline.
Note chart features:
1. China Construction Bank has been moving higher since its low in August last year. Based on price action, it can be observed to make a series of higher trading ranges, or a sequence of higher-lows and higher-highs. Moving averages agree as much. As at the end of this week, the bank closed above its entire basket of moving averages. This is a setup associated with further gains.
2. A downward trendline spanning over 26 months can be connected from previous tops. This line could act as potential resistance. Action over the previous weeks’ consolidation with long tails in contact with but recoiling from this trend line suggests that the market may be reacting to its presence.
3. Volume rose over the past three weeks. This suggests increasing participation in this stock and could be a positive input.
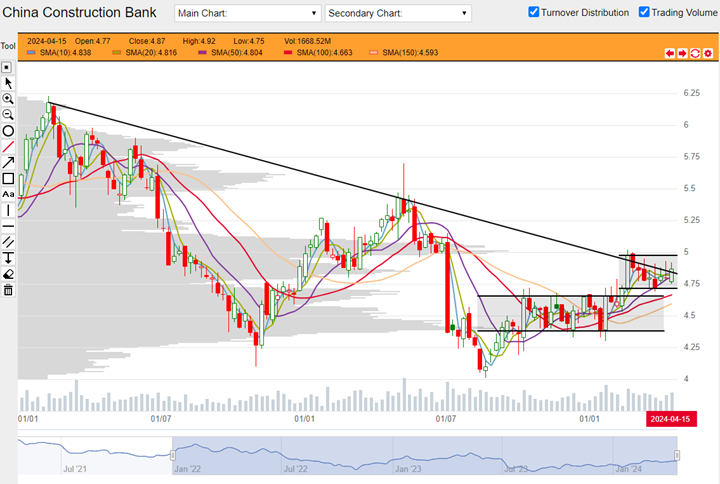
China Construction Bank 939.hk weekly chart from 03 January 2022 to 19 April 2024. (Source: DLC.socgen.com)
Underlying Index/Stock |
Underlying Chg (%)1 |
Long DLC (Bid Change%2) |
Short DLC (Bid Change%2) |
|---|---|---|---|
| Hang Seng Index (HSI) | -0.90% | ECSW (-4.89%) | CZRW (+6.09%) |
| Hang Seng TECH Index (HSTECH) | -1.29% | UQTW (-9.39%) | CVYW (+14.73%) |
| China Construction Bank (0939.HK) | -0.76% | DWCW (-1.37%) | EXXW (+2.31%) |
Brought to you by SG DLC Team
This advertisement has not been reviewed by the Monetary Authority of Singapore. This advertisement is distributed by Société Générale, Singapore Branch. This advertisement does not form part of any offer or invitation to buy or sell any daily leverage certificates (the “DLCs”), and nothing herein should be considered as financial advice or recommendation. The price may rise and fall in value rapidly and holders may lose all of their investment. Any past performance is not indicative of future performance. Investments in DLCs carry significant risks, please see dlc.socgen.com for further information and relevant risks. The DLCs are for specified investment products (SIP) qualified investors only.
Full Disclaimer - here